TRADING STRATEGY
The StockJumpers Strategy
StockJumpers Jump Reports and trade signals are designed for self-directed traders and professional money managers. Experienced Traders know that having advanced intelligence on the probable direction of a market move is an extremely powerful edge, but it’s not enough to guarantee profit. Timing, risk management, exit strategy, psychological discipline, are all necessary components of a successful trade. To generate consistent profits a Trader must treat investing as a business, deploying provable repeatable processes. Not all trades make money. Having a strategy with an edge and operating your strategy like a business, is what separates the profitable Traders from the losers or mediocre..
BOTH strategies can now be auto-traded.
This simple trading system shows you one way to work the StockJumpers information edge and create phenomenal profits. (This is only an example. You should always test any system with a virtual account before trading real money
Two simple proven strategy's that produce phenomenal profits...
There are lots of ways to leverage our technology and directional data, however the two simplest ideas are to trade the PRE-JUMP picks (Trade-Signals) and trade the JUMPS (Jump Reports) on the major movers in the after-market. Members who are active traders will do both. Members who don’t have the time or the stomach for trading just do the PRE-JUMPS picks. For more information on the PRE-JUMPS (which takes less than 15 minutes a week to manage – visit the PRE-JUMPS page and take a look at the video on how it works. The big money is made of course trading JUMPS… below is a simple way to do that and minimize your risk.
An Idea on how to trade the directional data
What’s required to turn our information edge into a profitable business – is capital, a system and the disciple to follow it. The strategies mentioned here are only a small example of how members can leverage StockJumpers data into profitable trades. Each Trader is an individual with their own risk-reward appetite, and way of trading. We are not Advisers and do not provide specific advice on any trade or how a member should trade their account, but we think adapting the strategies below to your trades can result in a highly profitable and satisfying trading business.
5/5 Strategy
The most obvious way to trade StockJumpers data may also be the most boring. Boring, but consistently profitable with relatively low risk is usually the better business plan. You simply buy or short the stock, an hour or so before market closes preceding the release of an Earnings announcement. For companies who release their earnings report after market close (AMC) you will enter your trade generally within one hour before the end of the trading day. If your target stock is releasing its earnings the following morning Before Market Opens (BMO) you would still enter your trade prior to the close of market the day before the announcement. The volumes will be high and your order should be easily filled at this time. Some traders look to optimize their profit by timing their entry based on market movement. You can certainly test this strategy however, with this system having a fixed take profit and stop loss its usually not necessary because you will (the majority of the time) have your Take Profit or Stop Loss targets reached, within an hour or two following release.
Each trade has a fixed stop loss (generally 3-5% – but this should be adjusted based on how you trade) and a take profit of 5-7%. The idea with this simply strategy is to have a risk-reward ratio that is equal or biased toward the upside. All you have to do is get the direction right the majority of the time to make money. (Assuming your stops are triggered correctly – which isnt always the case with a fast moving market)
Say your risk capital for each trade is $10,000. The target stock you are investing in is now trading at $20 per share, just before they announce their earnings release. You buy (or short) 500 shares @ $20 each. Put in your stop at 5% which for this example is $19 a share for a $1 loss and a take profit at $21 ($1 per share) which is a 5% profit. After the announcement the price will move and likely hit your target within a very short period of time. We’ve experimented with different percentages using this strategy and determined that in the majority of cases 5% provides enough leeway and a buffer for the volatility while the market settles on a direction, but controls the risk to only a 5% loss should the trade go against you. More sophisticated traders will create their stop (calculating their buy-back or sell position) using technical indicators such as VWAP (Volume Weighted Average Price), pivot points or their own custom formula for stops. (VWAP- is a simple indicator offered on most platforms and is a price averaging tool that takes into account volume and provides a more accurate picture of the average price).
Using the above numbers your profit on the trade would be $500 and your loss (should the directional data be wrong) is capped at 3-5%. Assuming you get the direction right 60% of the time, you will make money. (StockJumpers was statistically correct 70.5% for the first 6 months of 2015) And because you are doing this 4-5 times a week, recycling your capital over and over, never staying in the trade longer than 24 hours you are racking up the 5-7% wins against the 5% losers. The risk-reward is nearly equal and all you have to do is get it right the majority of the time to be profitable
Of course there are many variations to this strategy. For example some Traders set a 3% stop and a 7 or 8% take profit. Some Traders run the winners for as long as they can. A recent example was Twitter, Inc (TWTR) which beat Wall Street estimates and the stock jumped more than 30% in a matter of minutes. You would have made a quick 7% but a lot of profits would also be left on the table. The danger in leaving an open ended take profit, is that the price can easily bounce back to where it was or reverse, based on market sentiment or large traders taking profits. As a trader you also have the option of using trailing stops to lock in profit and as in the case of Twitter capture more if it really takes off. Some Traders prefer to control all this action manually (without stops) watching the chart and exiting when they see peak based on candles or volume.
Regardless of how you choose to play this very simple strategy the key thing to remember is making your strategy into a system. Doing the same “boring” trade actions over and over on each and every trade, and letting the statistical averages work in your favor is what creates a winning month. What doesn’t work is “cowboy trading” – second-guessing the data on some trades and following it on others. Your psychology can interfere with the outcome, and you punt or take less risk on some trades and more on others. You end of rolling the dice and betting the farm on a loser trade and going in too light on a winner. The result isn’t much better than gambling, and you lose money. The idea is to perform the same action on EACH AND EVERY trade and let the law of averages play out for you.
Trading the data once you get the hang of how to operate your trading system is relatively easy. You will enter your position usually at market price prior to end of day, but with a Sell or Buy to Close limit order as your stop or take profit as a normal stop may not execute after market close. The hard part of all this isn’t in order entry or trade allocation – it’s having the disciple to stick to a system. There is much temptation to end run the data or let your personal psychology interfere with operating this like a business
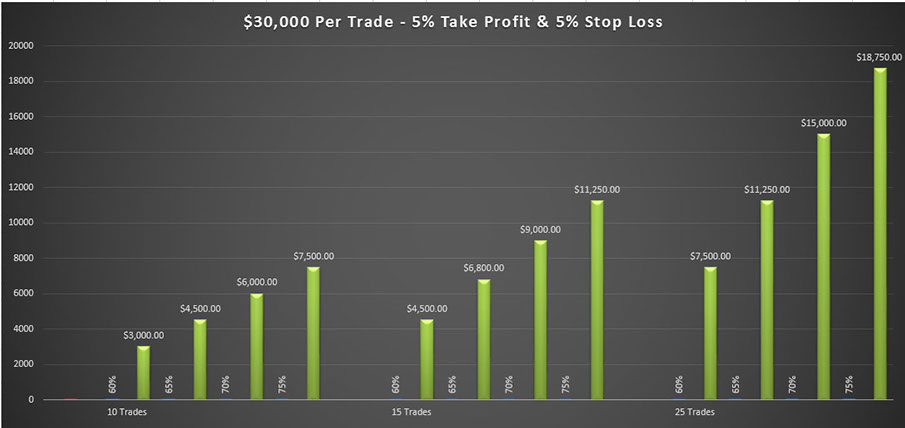
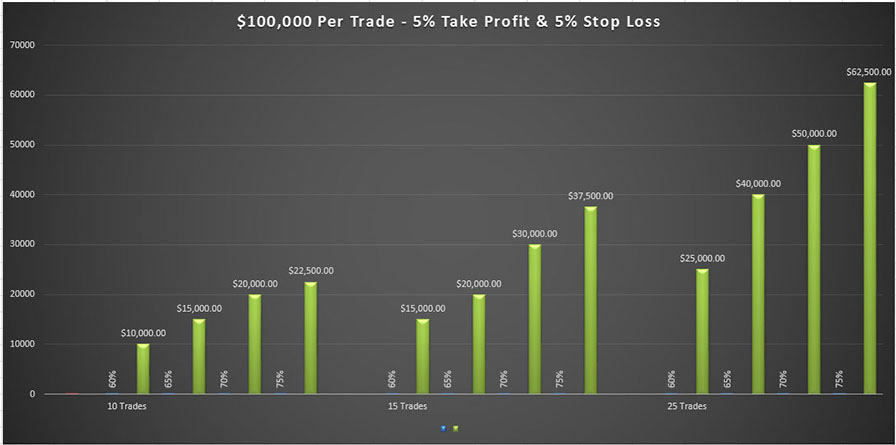
Below is a graphic example of what is possible trading this simple strategy for a one month period based on a trade allocation of $30,000 and $100,000 per trade event. Remember this is just one month of trades at 10, 15 or 25 positions, and though the numbers are all hypothetical you can see the enormous profit potential, even with a 60% win/loss ratio
30K Allocation Model (Monthly Profit/Loss)
Assumptions: 30k per trade, with a 5% Take Profit – 5% Stop Loss: 10-25 trades executed (StockJumpers publishes approximately 20 reports per month). Our win/loss ratio is displayed between 70-75% .
100K Allocation Model (Monthly Profit/Loss 100k per trade, with a 5% Take Profit – 5% Stop Loss: 10-25 trades executed (StockJumpers publishes approximately 25 reports per month). Our win/loss ratio is displayed between 60-75% .
IMPORTANT NOTE: The performance shown is hypothetical for presentation purposes only. These graphical models do not account for trades that jump more than 5%, (which most do) scratched trades, break even trades, small losers, bounce trades (trades you go back in on and capture additional profits). The chart is meant to display a model of what is possible. with a mechanical fixed system Your actual results WILL vary and could be significantly better or worse. Trading is extremely risky and you could lose a substantial amount of money even if the StockJumpers data is correct. There are many things that can go wrong like stops not executed and the markets go against you. Read ALL risk warnings and disclaimers before trading real money, and only trade funds you can afford to lose.


 by Team Stockjumpers